
Global ethanol production in 2026 builds on a record 121 billion liters (32.0 billion gallons) of fuel ethanol in 2025, according to the Renewable Fuels Association, and both of the largest producers expect higher output this year. The United States, forecast at about 64 billion liters, and Brazil remain the dominant producers, while India’s E20 program, Brazil’s move from E30 to E32 and record US exports drive most of the growth. Published forecasts range from 113 to 137 billion liters because they differ in base year, scope and whether they count fuel ethanol only or all ethanol uses. In Southeast Asia, Vietnam’s nationwide E10 mandate, in force since June 2026, has made the country a fast-growing ethanol importer, while Vietnamese producers such as Lê Gia continue to supply food, medical and industrial grades.
If you have tried to pin down a single 2026 ethanol figure for a budget, a supply contract or an investment memo, you have probably found three sources and three different answers. The gap between the lowest and highest published estimates is about 24 billion liters, more than twice India’s entire 2025 output, so picking the wrong number is not a rounding error but a planning error.
This guide reconciles those forecasts, ranks the leading producers using 2025 actuals and 2026 signals, and explains how feedstocks and blending mandates shape supply. It also shows where Vietnam fits after its E10 switch and closes with a practical framework for buyers who need reliable fuel, food, medical or denatured ethanol in 2026 and beyond.
How much ethanol will the world produce in 2026
The most reliable way to answer is to start from the 2025 actual and build in the country forecasts published during 2026, rather than relying on a single global projection made years earlier. That starting point is solid: the Renewable Fuels Association (RFA) puts 2025 world fuel ethanol production at a record 32.0 billion gallons, or roughly 121.1 billion liters.
Three country updates point to growth in 2026. The US Energy Information Administration (EIA) raised its 2026 forecast to 1.10 million barrels per day in May 2026, equal to about 63.8 billion liters and roughly 1.4 billion liters above 2025. In Brazil, analysts expect the 2026/27 harvest (April to March) to deliver between 36.5 and 44.5 billion liters, driven by higher blending and new corn ethanol plants. India, meanwhile, allocated about 10.5 billion liters for its 2025–26 supply year, slightly above its 2025 output.
One caveat matters for every buyer: these figures are production forecasts, not nameplate capacity. India alone has about 20 billion liters of installed capacity but needs only around 10–12 billion liters for E20, so capacity figures overstate what will actually reach the market.
Why do 2026 ethanol production forecasts range from 113 to 137 billion liters
The gap exists because the most-cited forecasts were built at different times and for different scopes, and they rarely say which. Once you check each figure’s base year and definition, most of the apparent disagreement disappears.
| Source | 2026 figure (billion L) | What it measures | Why it differs |
| OECD-FAO Agricultural Outlook (earlier edition) | ~137 | Total ethanol projection | Long-term projection from an earlier edition; check the publication year before citing |
| IEA estimate, cited in Colombia’s 2023 regulatory analysis | ~113.5 | Fuel ethanol production | Built before India’s E20 acceleration and Brazil’s E30 decision |
| Treebay Technology market review | ~115–118 | World production estimate | Commercial estimate with limited methodology disclosure |
| RFA, 2025 actual | 121.1 (2025) | Fuel ethanol, actual output | Already above the low-end 2026 forecasts |
Four factors explain most of the spread between these figures:
- Base year: forecasts made before 2023 could not anticipate India reaching E20 in 2025–26, five years ahead of its original 2030 target.
- Scope: “total ethanol” includes beverage, pharmaceutical and chemical uses, while “fuel ethanol” excludes them, and few reports state which one they mean.
- Calendar versus marketing year: Brazil reports by harvest season (April–March), India by supply year (November–October) and the US by calendar year.
- Policy assumptions: blend levels in Brazil, India and the US changed between 2024 and 2026, while older forecasts still reflect the previous rules.
The practical takeaway is simple: the 2025 actual already exceeds the low-end 2026 forecasts, so any figure near 113 billion liters is outdated rather than conservative.
What is the difference between fuel ethanol and industrial ethanol output
Fuel ethanol and industrial ethanol share the same molecule and often the same fermentation process, but they leave the plant with different specifications, buyers and price drivers. Most production statistics, including RFA’s world series, cover fuel ethanol only, so beverage, pharmaceutical, cosmetic and chemical ethanol sit outside the headline numbers.
Fuel ethanol is dehydrated to near-anhydrous strength and denatured before blending into gasoline. In the US, ASTM D4806 requires at least 92.1% ethanol by volume after denaturant is added, with water capped at 1.0% and methanol at 0.5%, while European fuel ethanol follows EN 15376. Demand is set mainly by blending mandates such as E10, E20 or E30.
Industrial, food and medical ethanol is usually sold as rectified spirit at about 95–96% v/v or as anhydrous ethanol at 99.5% or above. Buyers judge it on impurity limits rather than blend compliance, which is why a typical Certificate of Analysis (COA) reports alcohol strength, methanol, acetaldehyde, ethyl acetate, isopropanol, acidity, pH and color against stated limits.
For procurement teams, the distinction is critical because a tight fuel market can pull supply away from industrial users. RFA notes that India’s rapid move to E20 lifted fuel demand so quickly in 2025 that imported US ethanol was needed to backfill industrial uses.
Which methodology should B2B buyers trust for procurement decisions
No single source suits every decision, so the most reliable approach is to match each decision to the dataset built for it. Government and intergovernmental sources are strongest on volumes and policy, industry associations are fastest on monthly movements, and supplier documents are the only reliable basis for specifications.
| Decision | Best primary source | Update frequency | Watch-out |
| US supply and export availability | EIA Short-Term Energy Outlook, weekly EIA plant data | Monthly / weekly | Fuel ethanol only |
| Brazil harvest and sugar–ethanol mix | UNICA, Conab, USDA FAS GAIN reports | Biweekly / quarterly | Centre-South versus national totals |
| India demand and import needs | Ministry of Petroleum, PPAC, OMC tender results | Monthly | Supply year runs November–October |
| Long-term global outlook | IEA Renewables, OECD-FAO Agricultural Outlook | Annual | Check the edition date before citing |
| Grade and impurity compliance | Supplier COA, SDS and certificates | Per batch | Must match the exact product and lot |
A sound rule is to cross-check at least three independent sources before committing volumes and to treat any headline number without a stated scope as indicative only. For specification decisions, rely on lot-specific COAs, because regional averages cannot tell you whether a delivery meets your methanol or acetaldehyde limit.
Which countries lead global ethanol production in 2026
The United States and Brazil still produce about four of every five liters of fuel ethanol worldwide, together accounting for 79% of 2025 output according to RFA. IFPEN’s 2026 biofuels dashboard gives a similar split, with roughly half for the US and 30% for Brazil. India is the fastest riser, having overtaken the European Union in 2023 and reached 8% of world output in 2025, while the EU and China follow at a distance. The table ranks producers by 2025 output, the latest complete dataset, alongside the direction each market is heading in 2026.
| Rank | Country / region | 2025 output (billion L) | Share of world | Main feedstocks | 2026 signal |
| 1 | United States | 62.4 | 52% | Corn | EIA forecasts ~63.8 B L, a new record |
| 2 | Brazil | 32.7 | 27% | Sugarcane, corn | 2026/27 forecasts of 36.5–44.5 B L |
| 3 | India | 9.8 | 8% | Maize, FCI rice, cane juice, molasses | ~10.5 B L allocated for ESY 2025–26 |
| 4 | European Union | 5.7 | 5% | Wheat, corn, sugar beet | Broadly flat; imports fill the gap |
| 5 | China | 3.9 | 3% | Corn, cassava | Down from 4.4 B L in 2024 |
| 6 | Canada | 1.8 | 1% | Corn, wheat | Stable; largest buyer of US ethanol |
| 7 | Thailand | 1.5 | 1% | Molasses, cassava | Demand broadly flat through 2026 |
| 8 | Argentina | 1.2 | 1% | Corn, sugarcane | Stable |
| – | Rest of world | 2.0 | 2% | Mixed | Vietnam’s E10 mandate adds regional demand |
| World total | 121.1 | 100% |
Source: RFA, Annual World Fuel Ethanol Production, converted at 3.785 liters per gallon. Figures cover fuel ethanol only.
What feedstocks drive ethanol production by region
Feedstock is the best single predictor of where ethanol is produced, when it is available and how it is priced. Corn dominates North America and a growing share of Brazil, sugarcane anchors Brazil and much of India, wheat and sugar beet lead in Europe, and molasses and cassava supply Thailand, Vietnam and parts of China.
This matters to buyers in three concrete ways. First, feedstock sets seasonality, since grain can be stored and processed year-round while sugarcane must be crushed within weeks of harvest. Second, it shapes carbon intensity, which increasingly decides market access under low-carbon fuel rules in the EU, the UK, California and Canada. Third, it ties ethanol prices to other commodity markets, so a poor corn crop or a high world sugar price can tighten ethanol supply within a single season.
India shows how quickly feedstock mixes can shift under policy pressure. In just a few years, its ethanol allocation has moved from mainly molasses to mainly grain, with maize and FCI rice now covering about two-thirds of the 2025–26 tender volume.
How does corn-based production differ from sugarcane ethanol
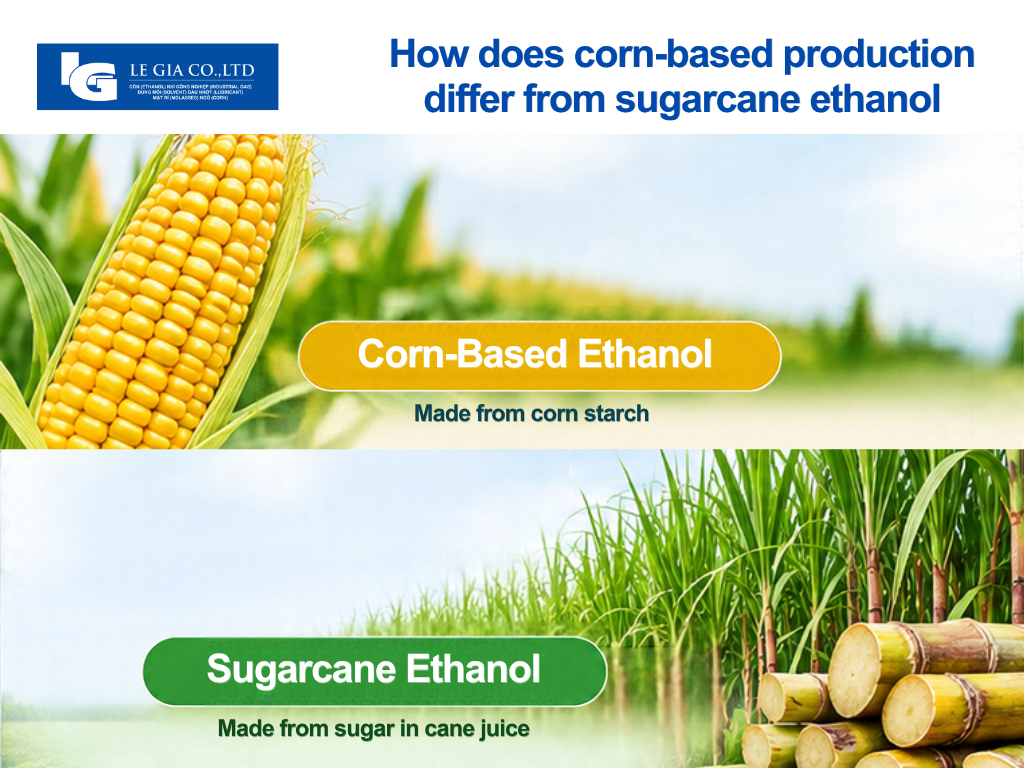
Corn and sugarcane ethanol end up as the same molecule, but they differ in process, energy source, co-products and timing, and those differences flow directly into price and supply reliability.
| Factor | Corn ethanol | Sugarcane ethanol |
| Main producers | United States, Canada, China, Brazil (fast-growing) | Brazil, India, Thailand (with molasses) |
| Conversion step | Starch must be broken down into sugars with enzymes | Sugars are fermented directly from juice or molasses |
| Process energy | Mostly natural gas in US dry mills | Mostly bagasse burned for steam and power |
| Main co-products | Distillers grains (DDGS), corn oil, CO₂ | Sugar, surplus electricity, vinasse |
| Seasonality | Year-round from stored grain | Peaks with the harvest, roughly April–November in Brazil’s Centre-South |
| Carbon intensity tendency | Higher, unless plants add carbon capture or renewable energy | Typically lower, helped by bagasse cogeneration |
The US model is built on scale and storage. According to USDA’s Economic Research Service, fuel ethanol used about 5.44 billion bushels of corn, or 36% of the US crop, in its latest marketing-year estimate. Distillers grains sold back into the feed market add a meaningful revenue line, which helps US plants stay competitive when ethanol prices soften.
Brazil increasingly runs both models side by side. Corn plants, fed almost entirely by the second-crop corn harvest in central Brazil, already supply about a quarter of Brazilian ethanol, and analysts expect that share to reach 25–30% in 2026/27. Because corn plants keep running after the cane harvest ends, this hybrid structure smooths supply and narrows the off-season gap that buyers used to plan around.
What role will cassava and cellulosic biomass play in 2026
Cassava and cellulosic biomass sit at opposite ends of maturity: cassava is a proven commercial feedstock across Southeast Asia, while cellulosic ethanol remains technically viable but commercially small.
Cassava matters most to Asian buyers. Producers in Thailand and Vietnam use fresh roots or dried chips, and dried chips can be stored and processed outside the harvest window, giving cassava plants more scheduling flexibility than cane-based mills. Vietnamese producers such as Lê Gia ferment cassava and molasses into bio-ethanol, and Vietnam’s nationwide E10 requirement, in force since 1 June 2026 under Circular 50/2025/TT-BCT, has added a large new fuel demand on top of this base. Cassava ethanol also lends itself to rectification into higher-purity grades, which makes it relevant to food, cosmetic and industrial buyers, not only fuel blenders. Lê Gia’s cassava-based undenatured ethanol lot of February 2026, for example, tested at 96.0% v/v with methanol at 32 ppm.
Cellulosic ethanol, made from crop residues such as corn stover or from energy grasses, continues to fall short of policy ambitions. In its 2026–2027 rule, the US EPA again partially waived the 2025 cellulosic biofuel requirement because production fell short. For 2026 planning, cellulosic ethanol is best treated as a niche, premium low-carbon product rather than a meaningful source of volume.
How do blending mandates affect global ethanol demand in 2026
Blending mandates are the main reason global ethanol demand keeps growing even as electric vehicles gain share, because they lock in a minimum share of ethanol in every liter of gasoline sold. In 2026, the decisive moves are happening in emerging markets rather than in the US or Europe, consistent with the IEA’s finding that growth is concentrated in Brazil, India and other fast-growing fuel markets.
| Market | Current requirement | 2026 status | Effect on demand |
| United States | RFS conventional biofuel: 15 billion gallons (~56.8 B L) | Final rule for 2026–2027 issued in March 2026 | Stable floor for corn ethanol |
| Brazil | E32 anhydrous blend in gasoline (temporary, from July 2026), plus E100 for flex-fuel cars | E32 valid for 180 days, extendable once; E35 under study | Strong growth; more cane diverted to ethanol |
| India | E20 average blend | Reached in ESY 2025–26 | Demand plateau of ~10–12 B L unless blends rise |
| European Union | RED III transport targets for 2030, 7% crop cap | Member states transposing into national law | Limited growth for crop ethanol; more imports |
| China | Low national blend rate | Effective national blend around 2% | Little growth |
| Vietnam | E10 for unleaded gasoline nationwide; E5 RON92 allowed until end-2030 | Applies from 1 June 2026 | New regional demand for fuel-grade ethanol |
The common thread is that mandates now differ more by country than ever, so a supplier’s home-market policy can absorb volumes that buyers abroad were counting on.
What impact will E20 policies have on production volume
E20 is the threshold where ethanol stops being an additive and becomes a structural part of the fuel supply, and India and Brazil show two very different ways of getting there.
India’s case is a planned leap. Average blending rose from 14.6% in 2023-24 to 19.2% in 2024-25 and reached 20% in 2025–26, with about 10.2 billion liters blended in the 2024–25 supply year alone. The government’s roadmap estimated that E20 would need about 10.16 billion liters a year, yet producers offered 17.76 billion liters in the 2025–26 tender, a clear sign that supply has overtaken demand. For 2026, the result is a production plateau rather than a surge, unless the government approves blends above E20, which producers are actively requesting.
Brazil’s case is incremental but larger in absolute volume. The move from E27.5 to E30 in August 2025 was first expected to add about 1.65 billion liters of demand, but stronger gasoline consumption pushed that estimate to roughly 2.76 billion liters. According to UNICA, the temporary step to E32 approved in July 2026 adds about 1 billion liters of anhydrous demand a year, and studies on E35 are already under way. Brazil also has a flexible second channel: flex-fuel drivers switch to pure hydrous ethanol whenever it is cheap enough relative to gasoline, which helped shield consumers when oil prices spiked in 2026.
For exporters and buyers, the lesson is that E20-level mandates turn producing countries into large consumers first and exporters second.
How are RED III and renewable fuel standards shaping trade
Europe and the US now shape global ethanol trade less through volume targets and more through rules on where fuel comes from and how it is certified.
Under RED III, adopted as Directive (EU) 2023/2413, member states must reach either a 29% renewable share in transport energy or a 14.5% cut in transport greenhouse-gas intensity by 2030. Crop-based biofuels remain capped at 7% of transport energy, while advanced biofuels and renewable fuels of non-biological origin must together reach at least 5.5%. In practice, this favors ethanol that can prove low carbon intensity under certified sustainability schemes and rewards suppliers whose documentation is audit-ready.
In the US, the Renewable Fuel Standard’s 2026–2027 rule sets total volumes of 26.81 billion gallons for 2026, holds conventional biofuel at 15 billion gallons and reallocates 70% of previously exempted small-refinery volumes. The more important signal for trade is forward-looking: EPA has announced that from 2028, foreign fuels and feedstocks will receive half the RFS compliance value of US-made products. That shift will make the US market harder for imported advanced ethanol and may redirect Brazilian exports toward Asia and Europe.
Taken together, these rules mean buyers should request sustainability certificates and origin documentation early in the sourcing process, not at the shipping stage.
What are the key trade flows and export opportunities for 2026
Global ethanol trade is small relative to production but highly concentrated, which makes it sensitive to a handful of policy decisions. The United States is the clear swing supplier: RFA reports that it exported a record 8.4 billion liters in 2025 to nearly 90 countries, worth about US$4.7 billion. According to USDA, five markets, namely Canada, the Netherlands, India, the United Kingdom and Colombia, took 76% of those shipments.
Trade frictions are just as concentrated. Brazil and China both maintain punitive barriers against US ethanol, while the EU’s sustainability rules decide which product qualifies toward its targets. Looking ahead, USDA has named Indonesia, Japan and Vietnam as Asian markets with large long-term potential and plans deeper engagement with India to reduce trade barriers. For Southeast Asian buyers, this points to more competition between US corn ethanol, Brazilian cane ethanol and regional cassava ethanol over the next few years.
Which countries are net exporters versus net importers
Only a few countries ship ethanol abroad in meaningful volumes, while a much longer list depends on imports to meet mandates or industrial demand. The table summarizes each major market’s trade position based on 2025 data.
| Market | Trade position | 2025 evidence | 2026 outlook |
| United States | Largest net exporter | Record 8.4 B L exported, ~13% of output | Further growth; EIA forecasts net exports rising in 2027 |
| Brazil | Exporter, but domestic-first | E30, now E32, absorbs most new supply | Exports depend on how far blending rises |
| Canada | Largest net importer of US ethanol | About 3.0–3.1 B L from the US, over one-third of US exports | Stable, supported by Clean Fuel Regulations |
| European Union | Net importer | Second-largest US market; volumes roughly doubled | RED III keeps import demand firm |
| United Kingdom | Net importer | Record 1.3 B L from the US | Steady |
| India | Importer for industrial use | US imports backfilled industrial demand during E20 | Capacity surplus may reduce import needs |
| Vietnam | Domestic producer and importer | Imports supplied most fuel ethanol in June–July 2026 | E10 keeps fuel-ethanol imports high; domestic non-fuel grades continue |
The pattern is telling: the strongest import growth comes from markets with carbon-intensity rules, such as Canada, the EU and the UK, rather than from markets that simply raise blend percentages. Suppliers who can document carbon intensity and origin are therefore best placed to serve the fastest-growing import demand.
How can procurement managers assess supply security by region
Supply security depends on five factors, and scoring each supplying region against them gives a clearer picture than price alone:
- Production volatility: exposure to drought, frost or harvest timing in the feedstock region.
- Regulatory stability: the likelihood that a domestic mandate change will absorb export volumes.
- Logistics: port, rail and tank-storage capacity between the plant and your site.
- Contract flexibility: force majeure terms, minimum volumes and allowed delivery windows.
- Supplier diversification: whether you depend on one plant, one country or one feedstock.
| Supply region | Main risk in 2026 | Best availability window | Practical mitigation |
| US Midwest and Gulf | Corn-price swings, hurricane-season port delays | Year-round | Index pricing; avoid single-port exposure |
| Brazil Centre-South | Mandate changes absorbing exports | April–November | Contract before harvest; add a non-Brazilian backup |
| India | Policy-driven export or import restrictions | Varies with tender cycles | Treat as opportunistic, not baseline supply |
| Southeast Asia (Vietnam, Thailand) | Cassava and molasses harvest variability | Extended by stored dried chips | Qualify more than one regional producer; lock specifications |
The goal is not to find a risk-free region, because none exists, but to combine regions whose risks do not peak at the same time.
Where does Vietnam fit in global ethanol production in 2026
Vietnam is a small producer by global standards, but in 2026 it became one of Asia’s fastest-changing ethanol markets, as its nationwide E10 mandate turned fuel ethanol into a large new demand stream almost overnight. The country sits within the “rest of world” group in RFA’s ranking, yet its policy shift now matters to every buyer sourcing ethanol in Southeast Asia.
Two features define Vietnam’s position. First, it has a long-established cassava and molasses ethanol industry serving food, beverage, pharmaceutical, cosmetic and industrial users. Second, its fuel-grade capacity is concentrated in a handful of plants, so the E10 transition is being met largely through imports. USDA has named Vietnam, alongside Indonesia and Japan, as an Asian market with large long-term potential for US ethanol.
How has E10 changed Vietnam’s ethanol supply and demand
E10 became mandatory for unleaded gasoline nationwide on 1 June 2026, and its effect on ethanol demand was immediate. Before the rollout, the Ministry of Industry and Trade (MoIT) warned that domestic output could cover only part of the new requirement, noting that only two to three of the country’s six ethanol plants had maintained relatively stable operations.
The first months confirmed that picture. According to the MoIT working group overseeing Circular 50, imports dominated ethanol supply in June 2026, while E10 already accounted for 94.3% of biofuel gasoline sales across more than 17,000 filling stations. Imports still made up about 78.6% of supply in July. The table summarizes the key indicators reported by Vietnamese authorities.
| Indicator | Figure | Reported by |
| E10 effective date | 1 June 2026, with E5 RON92 allowed until end-2030 | Circular 50/2025/TT-BCT |
| Estimated ethanol demand for E10 | 92,000-100,000 m³ per month | MoIT, May 2026 |
| Domestic ethanol output before rollout | About 25,000 m³ per month | MoIT, May 2026 |
| Total ethanol supply, June 2026 | 121,895 m³, of which 89,383 m³ imported | MoIT working group |
| Fuel-grade plants operating | 3 | MoIT working group |
| Estimated annual import cost | About US$1 billion | MoIT, May 2026 |
For buyers, the implication is clear: Vietnam is now a large importer of fuel ethanol while remaining a domestic producer of food, medical and industrial grades, so fuel and non-fuel supply chains should be evaluated separately.
What Lê Gia offers buyers sourcing ethanol from Vietnam
Lê Gia is a Vietnamese bio-ethanol manufacturer with Le Gia’s factory in Hóc Môn, Ho Chi Minh City, and around 20 years of experience in ethanol production and trading. Rather than competing on fuel volume, the company focuses on the non-fuel grades that manufacturers in Vietnam and across Asia rely on: food-grade, medical-grade and industrial ethanol with purity of up to 99.5%.
Four capabilities matter most to B2B buyers:
- Bio-ethanol from local feedstocks: ethanol fermented from cassava and molasses, backed by lot-specific COAs such as the February 2026 cassava lot.
- Denaturation and blending to order: as an ethanol denaturation specialist, Lê Gia blends formulations to each customer’s technical specification.
- Documented quality management: ISO 13485:2016 certification covering the production and trading of medical alcohol.
- Export reach and delivery: exports to more than 10 countries and territories, including Taiwan, South Korea, Australia, Canada, Thailand, Indonesia, India and Singapore, with delivery from 10 working days.
Lê Gia supplies manufacturers in pharmaceuticals, food and beverage, cosmetics, paint and electronics, and its 2025 company profile lists clients such as C.P. Group, Ajinomoto, Acecook, Nippon Paint and Siegwerk. For buyers navigating Vietnam’s E10-driven import demand, a domestic producer focused on non-fuel grades offers a practical way to keep food, medical and industrial supply on a stable footing.
How should B2B buyers evaluate ethanol suppliers for 2026
Global production numbers tell you whether ethanol will be available in 2026; supplier evaluation tells you whether the ethanol that reaches your site will be the right ethanol. The criteria differ sharply by end use, because a fuel blender cares about water content and blend compliance, while a pharmaceutical or cosmetics buyer cares about trace impurities measured in parts per million.
A practical evaluation covers four layers. The first is documentation: a lot-specific Certificate of Analysis, a current Safety Data Sheet and valid management-system certificates. The second is specification fit, meaning the supplier’s limits match your process rather than just a generic grade name. The third is supply capability, including feedstock security, storage, packaging and realistic lead times. The fourth is commercial structure, covering contract length, pricing basis and the share of volume that is firm versus optional.
The most common sourcing mistake is buying on grade labels such as “food grade” or “99%” without checking which standard, test method and batch the claim refers to.
What quality standards apply to food-grade and medical-grade ethanol
Food-grade and medical-grade ethanol are defined less by alcohol strength than by impurity limits and documentation, so buyers should always name the reference standard in the purchase specification. The table outlines how the main grades are typically specified.
| Grade | Typical strength | Reference standard | What buyers should verify |
| Fuel | ≥92.1% v/v after denaturant | ASTM D4806 (US), EN 15376 (EU) | Water, denaturant content, sulfur, sustainability certificate |
| Industrial / technical | 95–96% v/v or ≥99.5% v/v | Supplier specification | Color, acidity, non-volatile residue, denaturant type |
| Food / beverage | 95–96% v/v rectified | National food-safety standards | Methanol, aldehydes, esters, higher alcohols, origin |
| Pharmaceutical | 96% or anhydrous | European Pharmacopoeia, USP | Monograph limits, GMP status, lot traceability |
The European Pharmacopoeia monograph for ethanol (96 per cent) shows how strict medical grades are, with limits of 200 ppm for methanol, 10 ppm for acetaldehyde and acetal combined, and 2 ppm for benzene. Meeting these limits requires both clean fermentation and careful rectification, so buyers should ask for evidence against the monograph itself rather than a supplier’s in-house limit.
A well-structured COA makes these checks straightforward. Lê Gia’s COA for undenatured cassava ethanol (lot dated 3 February 2026) lists each parameter with its limit, result and test method: alcohol strength of 96.0% v/v by ASTM D4052, for example, and methanol of 32 ppm against a 100 ppm limit, with acetaldehyde at 10 ppm against a 40 ppm limit by gas chromatography. Because this COA covers a general-purpose product, medical and pharmaceutical buyers should always request a COA issued for the exact grade and lot they plan to purchase.
How do customized denatured ethanol specifications reduce supply risk
Denatured ethanol is ethanol made unfit for drinking by adding approved substances, which in many jurisdictions takes it outside beverage-alcohol taxation and opens it to industrial, cosmetic and cleaning applications. The commercial advantage is clear, but the real risk lies in choosing a denaturant that does not match your process or your destination market.
Regulators publish approved formulas for this reason. In the US, 27 CFR Part 21 lists dozens of specially denatured alcohol formulas, each tied to a defined set of authorized uses. The EU and other markets maintain their own lists, so a denaturant accepted in one destination may be rejected in another.
A customized specification reduces supply risk in three ways:
- Process compatibility: the denaturant is chosen so it does not react with resins, inks, fragrances or active ingredients in your formulation.
- Regulatory fit: the formula is matched to the destination market’s approved list before shipment, avoiding customs or tax disputes.
- Supplier flexibility: a producer that blends to order can switch denaturants when rules change, so you do not have to requalify a new source.
This is where specialist producers add value. Lê Gia blends denatured ethanol to each customer’s exact specification, so formulations can be adjusted for a new process or destination market without changing supplier.
What risks could disrupt 2026 ethanol supply chains
The main risks to 2026 supply are not a shortage of production capacity but sudden shifts in where that output is allowed or encouraged to go. Grouping them by type helps teams decide which risks to hedge and which to monitor:
- Production risks: drought in the US Corn Belt or Brazil’s cane regions, frost affecting second-crop corn, and natural-gas price spikes that raise US plant costs.
- Policy risks: further blend increases in Brazil that pull volumes into the domestic market, a possible move beyond E20 in India, and changes to Vietnam’s and other Southeast Asian E10 programs.
- Trade risks: continued Brazilian and Chinese barriers against US ethanol, and the US plan to halve RFS compliance value for foreign fuels and feedstocks from 2028.
- Logistics risks: Gulf Coast hurricane season, tank-storage constraints during harvest peaks, and container or ISO tank availability for packaged grades.
- Geopolitical risks: oil-price shocks, such as the 2026 spike linked to the conflict involving Iran, which raise gasoline prices, make ethanol blending more attractive and tighten supply for non-fuel buyers.
The 2026 oil shock is a useful reminder that higher fuel prices can be bad news for industrial ethanol buyers, because producers then favor the fuel market. Diversifying across at least two supplying regions and two feedstock types remains the most reliable hedge.
How can you secure reliable ethanol supply for your 2026 operations
Buyers who come through 2026 without disruption usually lock in specifications and baseline volumes early, then keep a flexible layer for price moves. A practical sequence looks like this:
- Define the specification first: grade, reference standard, denaturant if any, packaging and required documents, before asking for prices.
- Qualify two or more suppliers in different regions: request lot-specific COAs, SDS and current certificates, and test samples against your own limits.
- Structure the contract in layers: for example, a firm base volume with an optional lift, and a mix of fixed and index-linked pricing.
- Plan around seasons: schedule cane-based or cassava-based deliveries around harvest windows and keep safety stock for critical grades.
- Review quarterly: compare supplier performance, feedstock trends and mandate changes, then adjust volumes before contracts roll over.
Planning your 2027 volumes now? With Brazil diverting more cane to its own E32 blend and Vietnam’s E10 mandate drawing heavily on imported ethanol since June 2026, buyers who confirm specifications early secure the most reliable allocations.
Lê Gia is a Vietnamese bio-ethanol manufacturer and ethanol denaturation specialist, producing food, medical and industrial ethanol from cassava and molasses and blending denatured formulations to customer specifications. Le Gia Ethanol company holds ISO 13485:2016 certification and exports to more than 10 countries and territories, including Taiwan, South Korea, Australia, Canada, Thailand, Indonesia, India and Singapore. Send your specification to ethanol@legia.vn or call +84 908 769 151 to receive a lot-specific COA and a quotation.
FAQ: global ethanol production 2026
What is the projected CAGR for global ethanol production through 2030
No authoritative body publishes a single global production CAGR to 2030; revenue-based market reports cite about 3.3% a year, while volume growth is concentrated in Brazil and India, where the IEA expects Indian ethanol use to exceed 15 billion liters by 2030.
How does ethanol carbon intensity vary by feedstock and region
Bagasse-powered sugarcane ethanol typically scores lower than natural-gas-fired corn ethanol, although corn plants using carbon capture or renewable energy can narrow the gap; exact values differ under EU, US federal and Californian rules, so buyers should request plant-specific certified figures.
Will CBAM and EUDR regulations affect ethanol import costs
Neither applies directly: the EU’s CBAM covers cement, iron and steel, aluminium, fertilizers, electricity and hydrogen, and the EUDR does not list sugarcane or corn, so for ethanol the binding EU requirement remains RED III sustainability certification.